
List of Abbreviations
| Abbreviation | Definition |
| FDOE | Florida Department of Education |
| FSDs | Florida School Districts |
| DG | District Grade |
| GR | Graduation Rate |
Introduction
Schools, districts, regions, and countries around the world are often looking to summarize and predict their progress to set themselves apart from their competitors. Education ranking systems are how people determine which university to attend, which neighborhood to raise a family in, and which country they venture to for employment endeavors. “How do we stack up?” Is the question that stakeholders around the world ask themselves over and over in myriad ways.
To this end, the Florida Department of Education (FDOE) collects scholastic data from their schools and districts. They summarize and predict their high school progress through a set of assessments which are completed by their schools. Recently, the FDOE has used this data to build toward their number one ranking among states in the USA (Florida Department of Education, 2023; U.S. News & World Report, 2023). Interestingly, while Florida ranks number one in higher education (university and college), they only rank fourteenth in Kindergarten to Grade 12 education. Both rankings combine to earn the state the honor of number one overall. Thus, it was of interest to me to learn more about what education benchmarks the State of Florida assesses and how their individual school districts perform. My hope was that this learning would help me to understand the usefulness of standardized assessments and their correlations to school success.
The FDOE uses metrics called “School Grades” and “District Grades” (DG) to track the academic achievement of their schools and districts respectively. School grades are made up of the percentage of the student body meeting pre-determined achievement levels on as many as 11 applicable criteria. “The school’s grade is determined by summing the points earned for each component and dividing this sum by the total number of available points for all components with sufficient data” (Florida Department of Education, 2022a, p. 27). The 11 components which make up School Grades are as follows: ELA, math, science, and social studies achievement components; learning gains in ELA, math; learning gains for the lowest performing academic students; middle school acceleration; graduation rate (GR); and college and career acceleration (Florida Department of Education, 2022a, p. 5). To achieve accurate and comparable results, districts are asked to test 95% of their student population. The assessments and surveys are conducted throughout the school year and GRs are finalized in January. Likewise, “the district’s grade is calculated as if the district’s students are enrolled in one large combination school. All students who are full-year enrolled in the district will be included in the district’s grade” (Florida Department of Education, 2022a, p. 28). In summary, schools earn School Grades by meeting achievement levels on particular criteria. Similarly, districts earn DGs based on the combined achievement levels of their individual schools.
Based on a brief examination of the 2022 Florida School District Grade data (Florida Department of Education, 2022b) coupled with first-hand experience of the difficulty that many schools experienced as a result of the COVID-19 pandemic (Barbosa & Vieira, 2020; Raban & Dhurumraj, 2023), the following research questions were created: 1) Is there a relationship between district grade and graduation rate among Floridian public school districts? In this case, the independent variable is District Grade and the dependent variable is 2021 Graduation Rate. 2) How have district grades changed from 2010 – 2022 among Floridian public school districts?
These questions led to the creation of the following hypotheses: 1) There is a relationship between district grade and graduation rate among Floridian public school districts. In order to deepen my understanding of quantitative methods, I created both null and alternative hypotheses for hypothesis 1): Null Hypothesis (H0) = There is no relationship between district grade and graduation rate among Floridian public school districts. Alternative Hypothesis (Ha) = There is a relationship between district grade and graduation rate among Floridian public school districts. 2) District grades in Floridian public school districts increased from 2010 – 2019, then decreased from 2020 – 2022 due to factors surrounding the COVID-19 pandemic. In creating these hypotheses, my goal was to try my hand at the applications of quantitative methods, which are admittedly outside of my comfort zone, to expand my knowledge on the subject.
Methods
The target population for this project was public schools in Florida. The FDOE DG data covers a significant proportion of this population, as the data includes at least 95% of the district population being tested in its sample. To provide the most accurate results, this project examined all of the available data related to DGs and GRs.
The FDOE DG data is presented in letter grades: A, B, C, D, & F. For context, the FDOE uses the following scale for School Grading Percentages: A = 62% or greater, B = 54% to 61%, C = 41% to 53%, D = 32% to 40%, F = 31% or less. To make the letter grades more workable in excel, I traded the letters for the median number in the grade range provided by the FDOE for that particular letter: A = 81, B = 58, C = 47, D = 36, F = 16.
It should be noted that the data provided by the FDOE did not include GR data for 2022 and provided limited 2021 DG data (only 17% of districts) due to the COVID-19 pandemic. Instead, the FDOE data provided GR for the 2020-21 school year. Thus, I was left with a skewed comparison between 2021 GR and 2022 DG. I used Excel as a tool to compare and work the data to produce the graphs and tables which are highlighted in the Discussion of Analysis section.
Discussion of Analysis
Research Question 1
The following figures and tables were created from the data to present answers to the research questions and answer the hypotheses. First, let’s examine research question 1: Is there a relationship between district grade and graduation rate among Floridian public school districts?
Figure 1
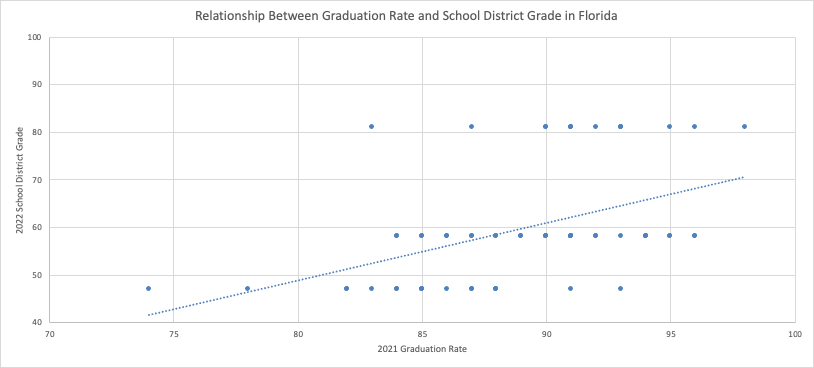
As is shown in Figure 1, there is a marked difference between: i) DGs of 58 (B) and 47 (C) as they relate to GR; ii) DGs of 81 (A) and 47 (C) as they relate to GR. According to Figure 1, Florida School Districts (FSDs) with DGs of 47 (C) are more likely to have lower GRs. On the other hand, FSDs with DGs of 81 (A) or 58 (B) are more likely to have higher GRs. Surprisingly, FSDs with DGs of 81 (A) are not more likely to have higher GRs than those with lower DGs of 58 (B). Therefore, this graph does not suggest that there is a relationship between DG and GR when comparing the DGs of 81 (A) and 58 (B).
Figure 2
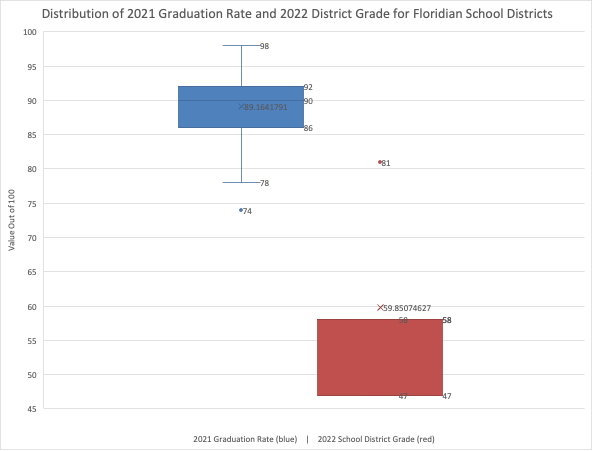
Figure 2 shows an additional way to examine the relationship between the 2021 GR and 2022 DG. This box and whisker chart shows the distribution, mean, and outliers of both values. Although both GR and DG are on a 100-point scale, one is a percentage, the other is the median score on a letter grade scale (as mentioned in the Methods section). GR is a statistic that the FDOE is incentivised to have as high as possible. While DG is an accountability metric used to improve schools. Thus, the comparison between GR and DG is not direct. In the end, Figure 2 is less of a relationship graph and more of a side-by-side comparison between two potentially connected values.
Figure 3
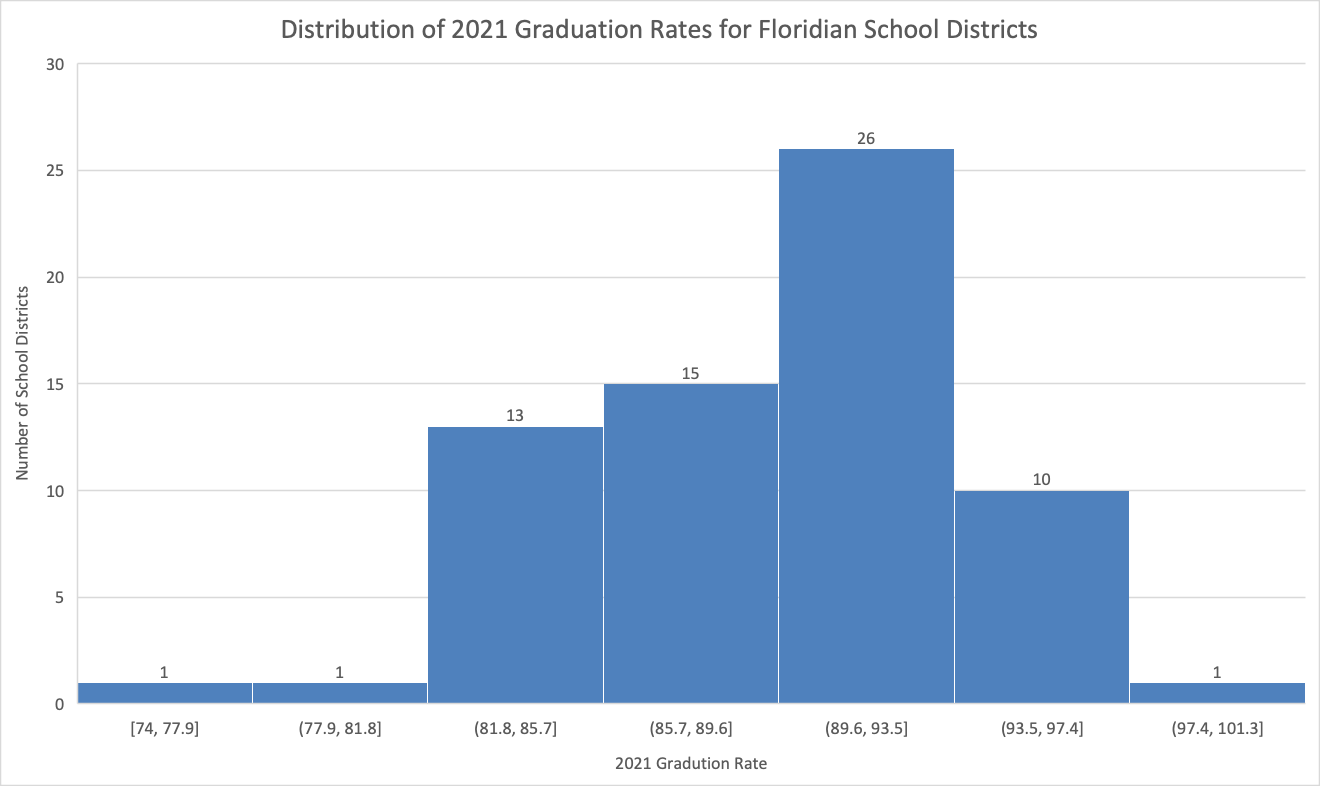
Figure 3 displays the distribution of 2021 GR among FSDs. The most common distribution range is from 89.6% – 93.5% GR, with 26 school districts falling within this range. This figure is a helpful visual to represent one of the most valuable culminating metrics of any public school system, their ability to graduate students.
Table 1
| Grad Rate 2020-21 | Grade 2022 | Optional Grade 2021 | Grade 2019 | Grade 2018 | |
| Grad Rate 2020-21 | 1 | ||||
| Grade 2022 | 0.457765246 | 1 | |||
| Optional Grade 2021 | -0.030984858 | 1 | 1 | ||
| Grade 2019 | 0.432505167 | 0.747861071 | 1 | 1 | |
| Grade 2018 | 0.503051482 | 0.834026665 | 1 | 0.840796487 | 1 |
In the Table 1 correlation matrix, values range from -1 to 1. Numbers between 0 and 1 represent a more significant relationship between two variables. I chose to include DGs from 2018 – 2022 in order to show the available DG data which acted as potential correlators to the success of the 2021 GR. To flesh this out, students in Grade 9 in 2017/18 who proceeded to the next grade in each successive year would have graduated in 2021. Thus reaping the benefits of FSDs with higher DGs during each year of their high school experience. Finally, 2022 DG was included as a comparison to the previous DGs and was the closest complete DG category to the dependent variable, 2021 GR.
Things that jump out from Table 1: i) There is a moderate positive relationship between all three of 2018, 2019, and 2022 DGs and 2020-21 GR. ii) There is no relationship between 2021 DG and 2020-21 GR. Which is further evidence to support the difficult time that Floridian schools were experiencing during the first full school year of the COVID-19 pandemic.
Table 2
| SUMMARY OUTPUT | |
| Regression Statistics | |
| Multiple R | 0.457765246 |
| R Square | 0.209549021 |
| Adjusted R Square | 0.197388236 |
| Standard Error | 4.041570594 |
| Observations | 67 |
| ANOVA | |||||
| df | SS | MS | F | Significance F | |
| Regression | 1 | 281.4649935 | 281.465 | 17.2315 | 9.82501E-05 |
| Residual | 65 | 1061.729036 | 16.3343 | ||
| Total | 66 | 1343.19403 |
| Coefficients | Standard Error | t Stat | P-value | Lower 95% | Upper 95% | |
| Intercept | 78.78241154 | 2.549248756 | 30.9042 | 1.4E-40 | 73.69121021 | 83.87361 |
| Grade 2022 | 0.173460954 | 0.041786857 | 4.15109 | 9.8E-05 | 0.090006838 | 0.256915 |
In Table 2, the independent variable was 2022 DG while the dependent variable was 2021 GR. This simple linear regression table shows a p-value of 9.8 E-5. This represents an exceedingly small number which means the null hypothesis is rejected in this case. Thus, the alternative hypothesis which states there is a relationship between district grade and graduation rate among Floridian public school districts is supported.
Research Question 2
Now, let’s examine research question 2: How have district grades changed from 2010 – 2022 among Floridian public school districts?
Figure 4
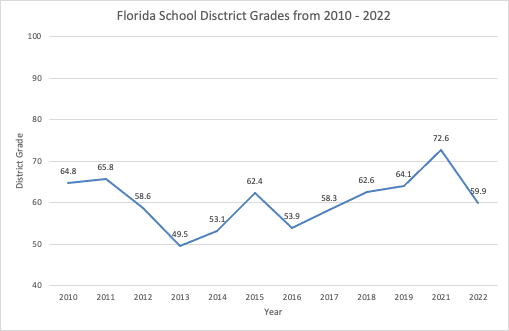
As we can see from Figure 4, the average DG for FSDs did not increase from 2010-2019. Instead, DG fluctuated numerous times within that date range. This means that the first half of my second hypothesis is rejected. The second half of the hypothesis, that the district grade decreased from 2020 – 2022 due to the pandemic is difficult to determine conclusively because of the lack of DG data for 2020. Although only 17% of FSDs submitted DG data in 2021, the DG did decrease from 2021 to 2022. Thus, my second hypothesis is partially correct. Because the available data showed a decrease in DGs between two years in the COVID-19 pandemic. There is no explicit data to suggest this decrease was due to the pandemic, but the pandemic certainly affected many elements of the scholastic experience in FSDs from 2020-2022.
Critical Analysis of Results
As previously mentioned, the FDOE data does not line up to directly compare either 2021 GR & DG (limited data) or 2022 GR & DG. This is no fault of the FDOE, as both school years were dampened by the COVID-19 pandemic. However, more work can be done by FDOE to line up the 2023 data for both DG and GR for FSDs to lead to more significant discussions and suggestions.
Improvements
There are numerous ways in which my research could have been improved: i) A better understanding of quantitative methods, ii) Previous experience writing reports like this project. This was my first experience in this format, ii) As mentioned in the previous paragraph, having more FDOE data which lined up would have helped. To this end, I welcome other researchers to run this research through their own analysis to draw more meaningful conclusions.
Future Research On This Topic
Now that I have worked with this data set and have learned about the recent success of the FDOE, it would be interesting to learn which tests that make up DGs are most influential on GRs. This inquiry is outside the scope and the data available in this study. However, it could be valuable to note and share with the FSDs for the benefit of their stakeholders.
Conclusion
This brief examination of the recent academic results from the state of Florida explored the following research questions: 1) Is there a relationship between district grade and graduation rate among Floridian public school districts? In this case, the independent variable was DG and the dependent variable was 2021 GR. 2) How have district grades changed from 2010 – 2022 among Floridian public school districts? This project used the following hypotheses: 1) There is a relationship between district grade and graduation rate among Floridian public school districts. 2) District grades in Floridian public school districts increased from 2010 – 2019, then decreased from 2020 – 2022 due to factors surrounding the COVID-19 pandemic.
Based on the results, the following conclusions have been made: 1) There is a moderate positive relationship between 2018, 2019, and 2022 DGs and 2021 GR among FSDs. My hypothesis was correct and the alternative hypothesis was supported. 2) DGs in FSDs fluctuated from 2010-2019, then decreased from 2021-2022 based on the available data. My hypothesis was partially correct.
This project presented a worthwhile challenge to learn about the recent success of the education system in the state of Florida. It was enjoyable to expand my understanding about the ways they assess, which types of assessments they prioritize, and how they promote accountability between their school districts. This project has provided me a touchpoint for future learning on these topics and I am interested to see how it can be weaved into my career as an educational leader.
Thank you for taking the time to read this article. It was a pleasure spending time with you today.
Peace & Blessings,
– Josiah
References
Barbosa, S., & Vieira, M. (2020). School Culture and Innovation: Does the Post-Pandemic World COVID- 19 Invite to Transition or to Rupture? European Journal of Social Sciences Education and Research, 7, 2312–8429. https://doi.org/10.26417/922sju94c
Cheusheva, S. (2023, May 4). Linear regression analysis in excel. Ablebits. https://www.ablebits.com/office-addins-blog/linear-regression-analysis-excel/
Dhuey, E. (2023). Lecture 5 [Video lecture]. Quercus. https://q.utoronto.ca/courses/320930/files/27144727?module_item_id=4892510
Florida Department of Education. (2022a). School grades calculation guide 2021-22. Florida Department of Education. https://www.fldoe.org/core/fileparse.php/18534/urlt/SchoolGradesCalcGuide22.pdf
Florida Department of Education. (2022b). Florida school accountability reports 2022, district grades. [Data set]. Florida Department of Education. https://www.fldoe.org/accountability/accountability-reporting/school-grades/
Florida Department of Education. (2023, May 4). Florida is ranked as number one state for education by U.S. news & world report. Florida Department of Education. https://www.fldoe.org/newsroom/latest-news/florida-is-ranked-as-number-one-state-for-education-by-u-s-news-world-report.stml
Microsoft. (2023). Change the scale of the vertical (value) axis in a chart. Microsoft Support. https://support.microsoft.com/en-us/office/change-the-scale-of-the-vertical-value-axis-in-a-chart-05973661-e56a-4486-a9f3-f9ce41df0021
Raban, F., & Dhurumraj, T. (2023). The influence of school culture on teacher development during Covid-19. International Journal of Research in Business and Social Science (2147- 4478), 12(3), Article 3. https://doi.org/10.20525/ijrbs.v12i3.2430
Turney, S. (2023, June 22). Null & alternative hypotheses. Scribbr. https://www.scribbr.com/statistics/null-and-alternative-hypotheses/
U.S. News & World Report. (2023). Education. U.S. News. https://www.usnews.com/news/best-states/rankings/education

Leave a comment